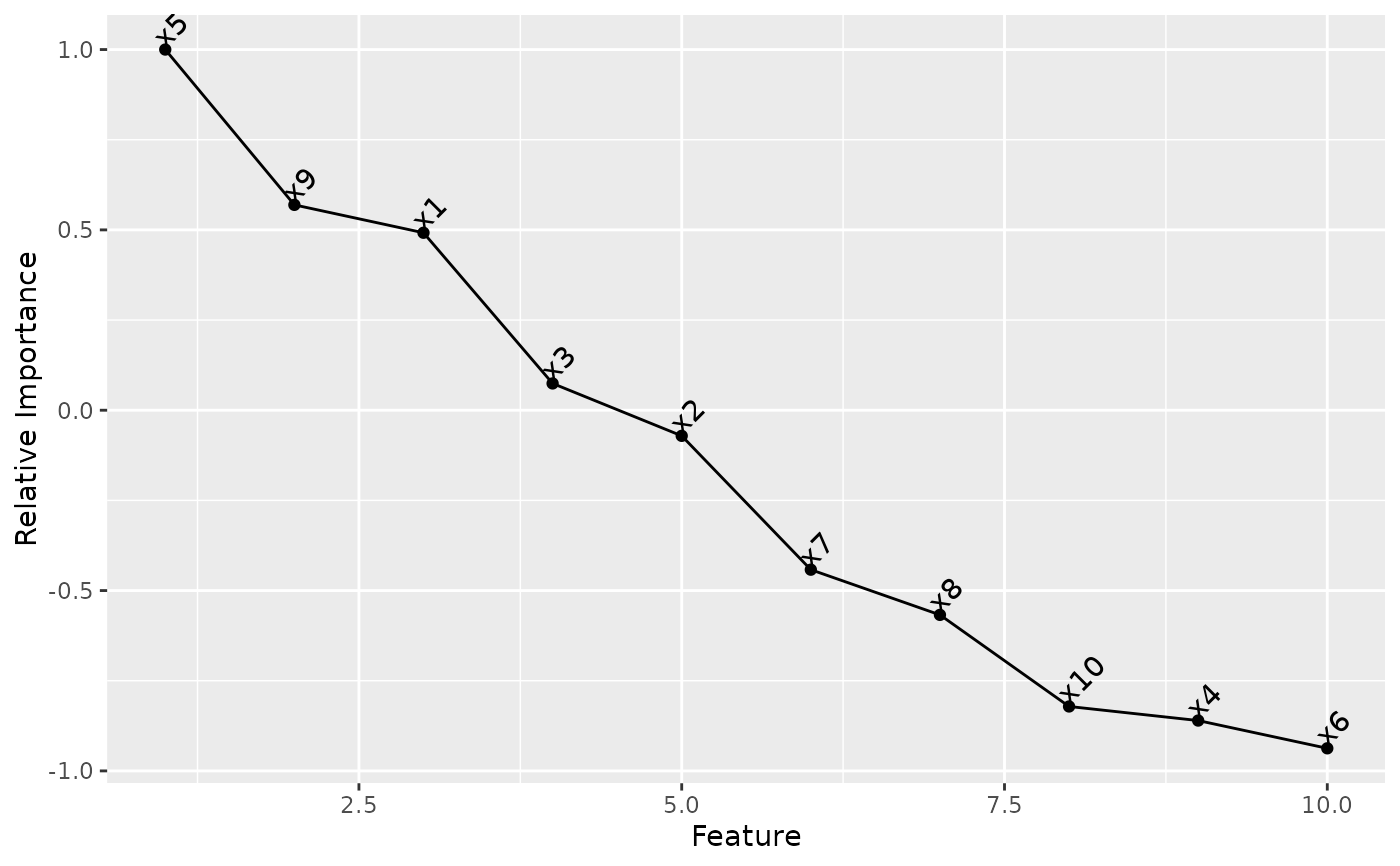
Generate scree plot showing the feature importance
Examples
features_scores <- c(
  x1 = 0.8165005, x2 = -0.1178857, x3 = 0.1232284, x4 = -1.4277472,
  x5 = 1.6594211, x6 = -1.5554892, x7 = -0.7336138,
  x8 = -0.9416054, x9 = 0.9448299, x10 = -1.3629773
)
get_scree_plot(features_scores)
